Rethinking Observability

Observability shouldn't be hard or expensive

Unlike other tools, Kerno doesn’t demand thousands of engineering hours, petabytes of data, restrictive usage limits, or your entire budget to deliver useful observability. Instead, it's fast to install, easy for any engineer to use, and cost-effective to run. Simple.

Get developer buy-in

Designed for everyone on your team

Reduce cost by up to 70%

Optimized for cost efficiency at scale

Set up and switch on in minutes. 

Get end-to-end K8s observability in minutes powered by eBPF

Install Kerno with a single Docker command and start seeing fully pre-configured dashboards, service maps, and all your application and infrastructure data in minutes without extra work for your engineering and Ops teams.

Instrument once, without any code changes, dev cycles, or complex configurations

Kerno uses eBPF to automatically capture granular application and infra data without requiring engineers to instrument their code continuously.

Kerno's in-cloud architecture

Store data securely inside your cloud without building or maintaining data pipelines

Kerno automatically deploys and manages everything you need to collect, process, and store data inside your cloud as cheaply and effectively as possible.

Get payload-level insights

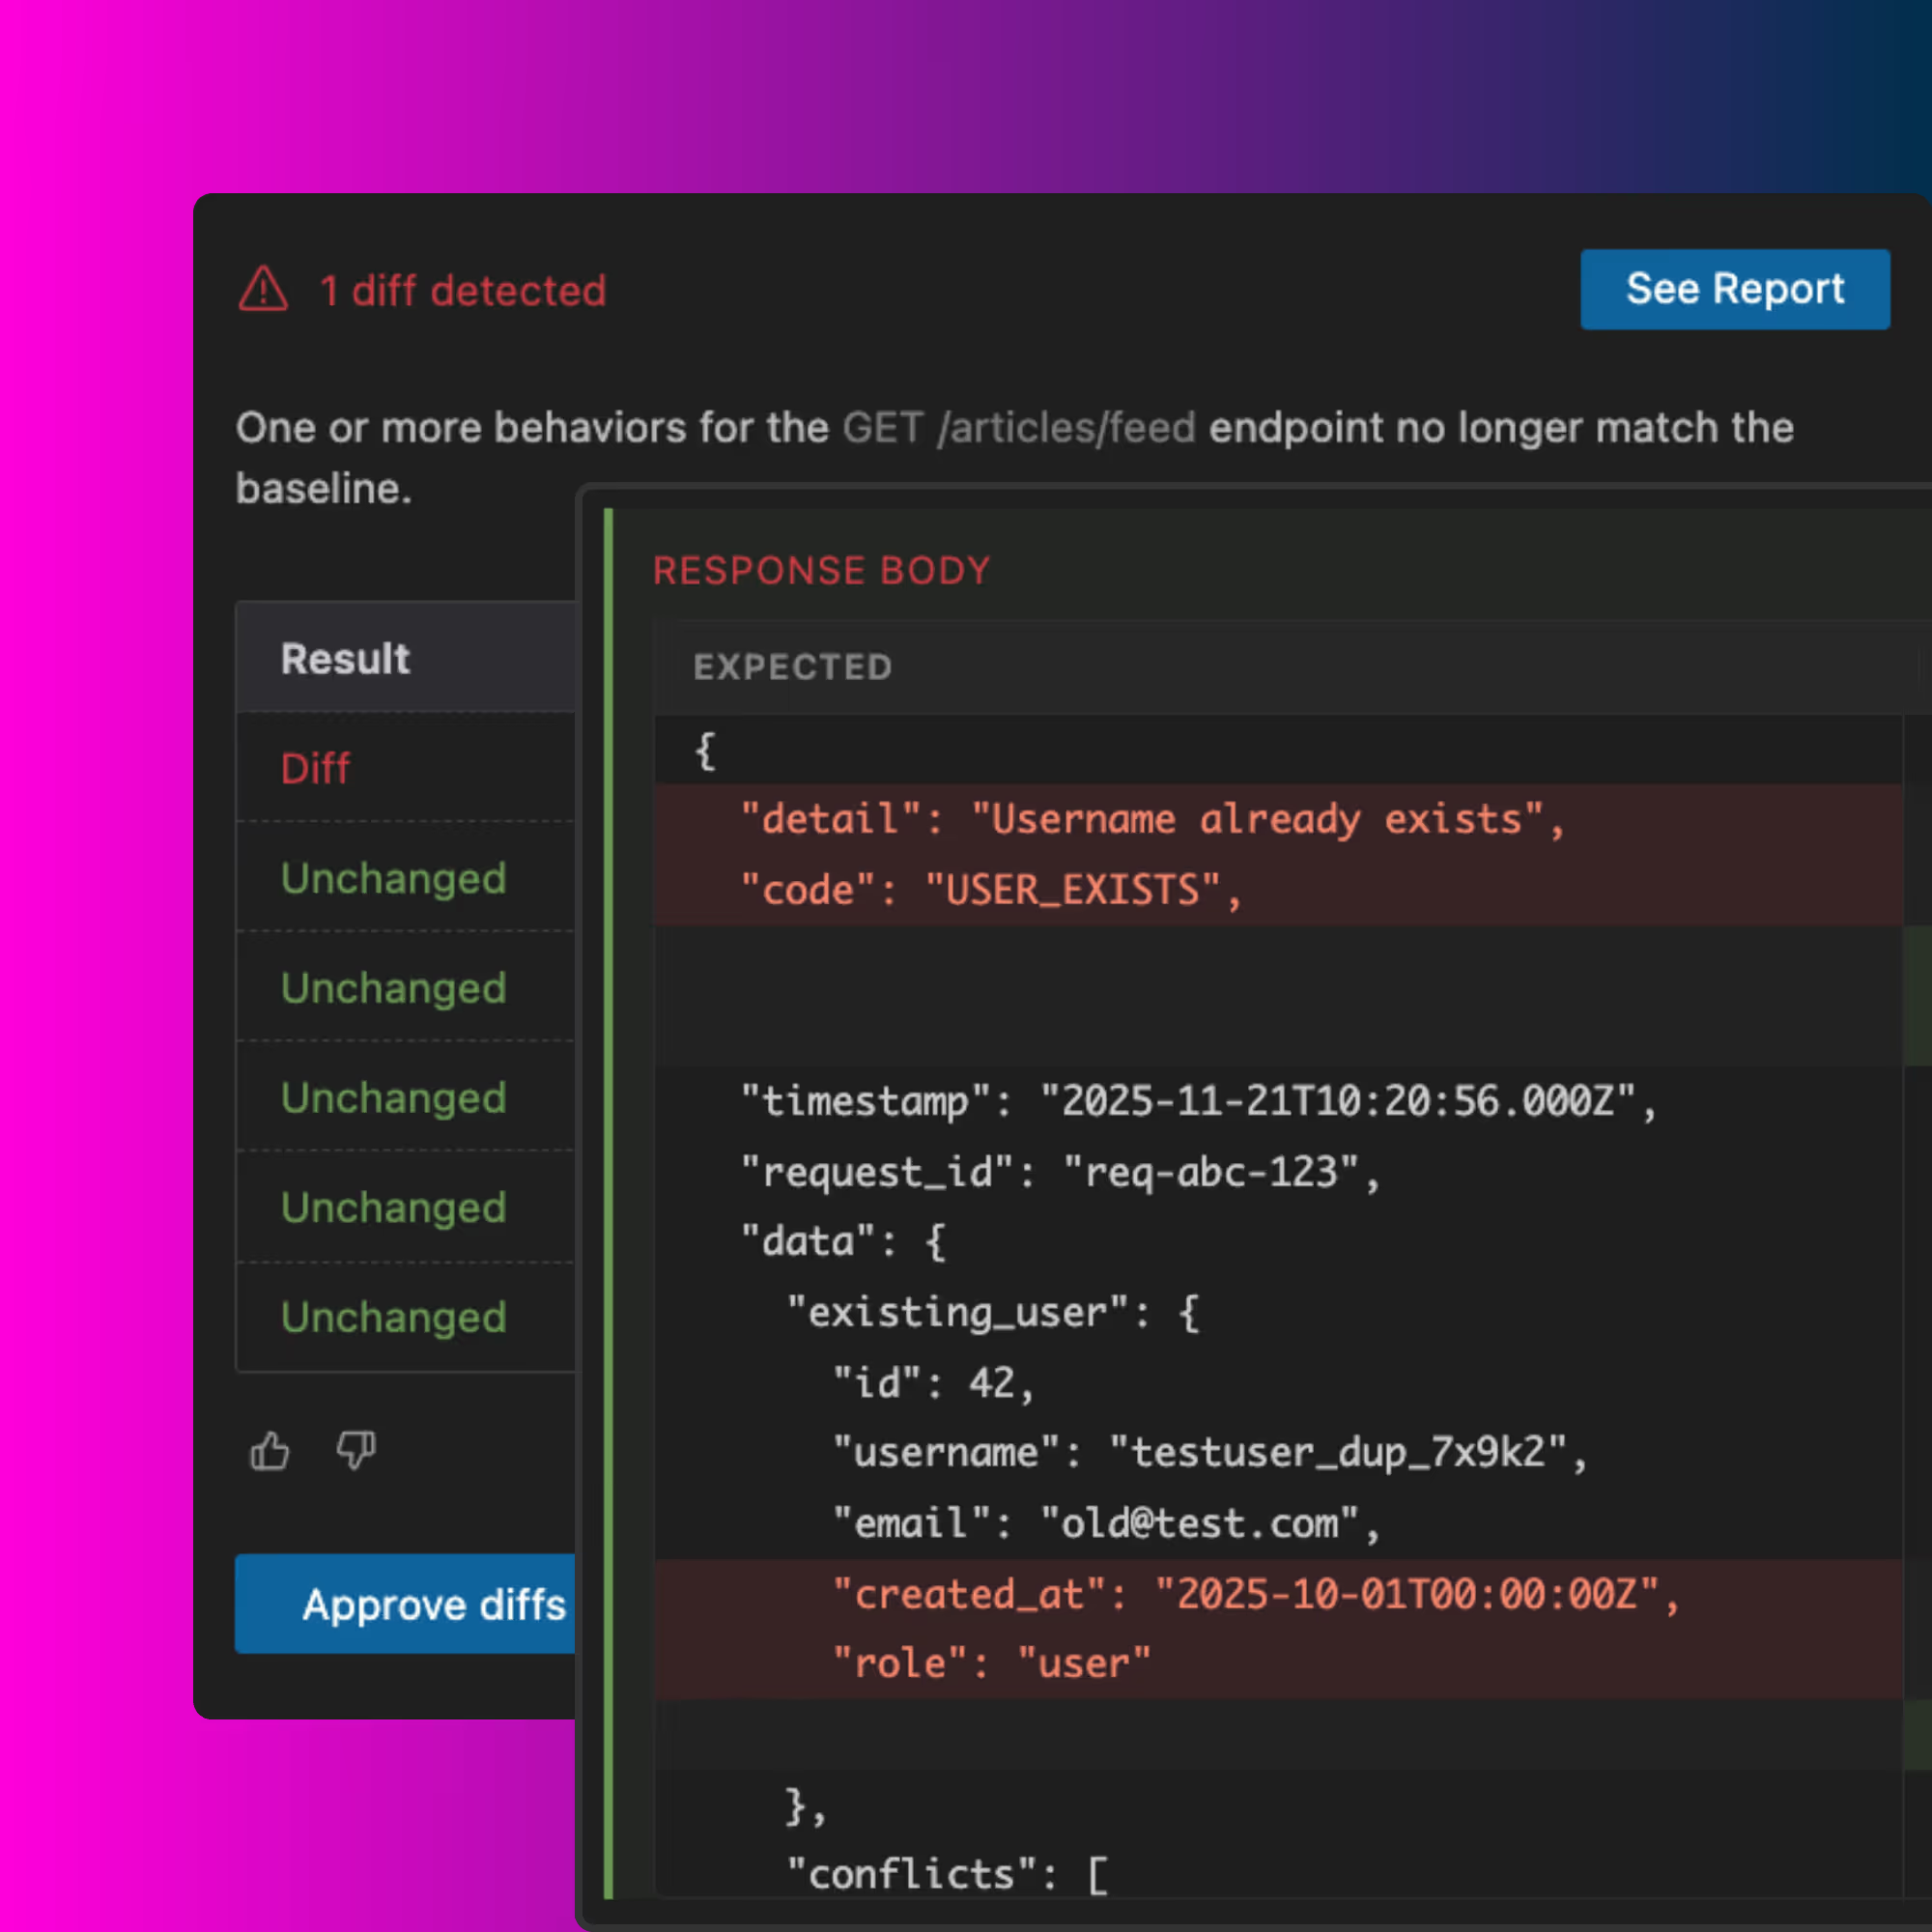
Get full trace payload data including request bodies, headers, and code-level insights

Minimize system footprint at scale

Zero impact on application latency and minimal CPU and memory usage at scale.

Deploy across clusters

Deploy across multiple clusters in just a few clicks.
Built for the 99% of engineers

Lower the barrier for developer adoption

Align your team around a simple, service-centered observability model that reflects how you naturally think about software. This makes the experience more intuitive for every engineer, enabling them to contribute more effectively to reliability.

Bridge the knowledge gap with a unified view

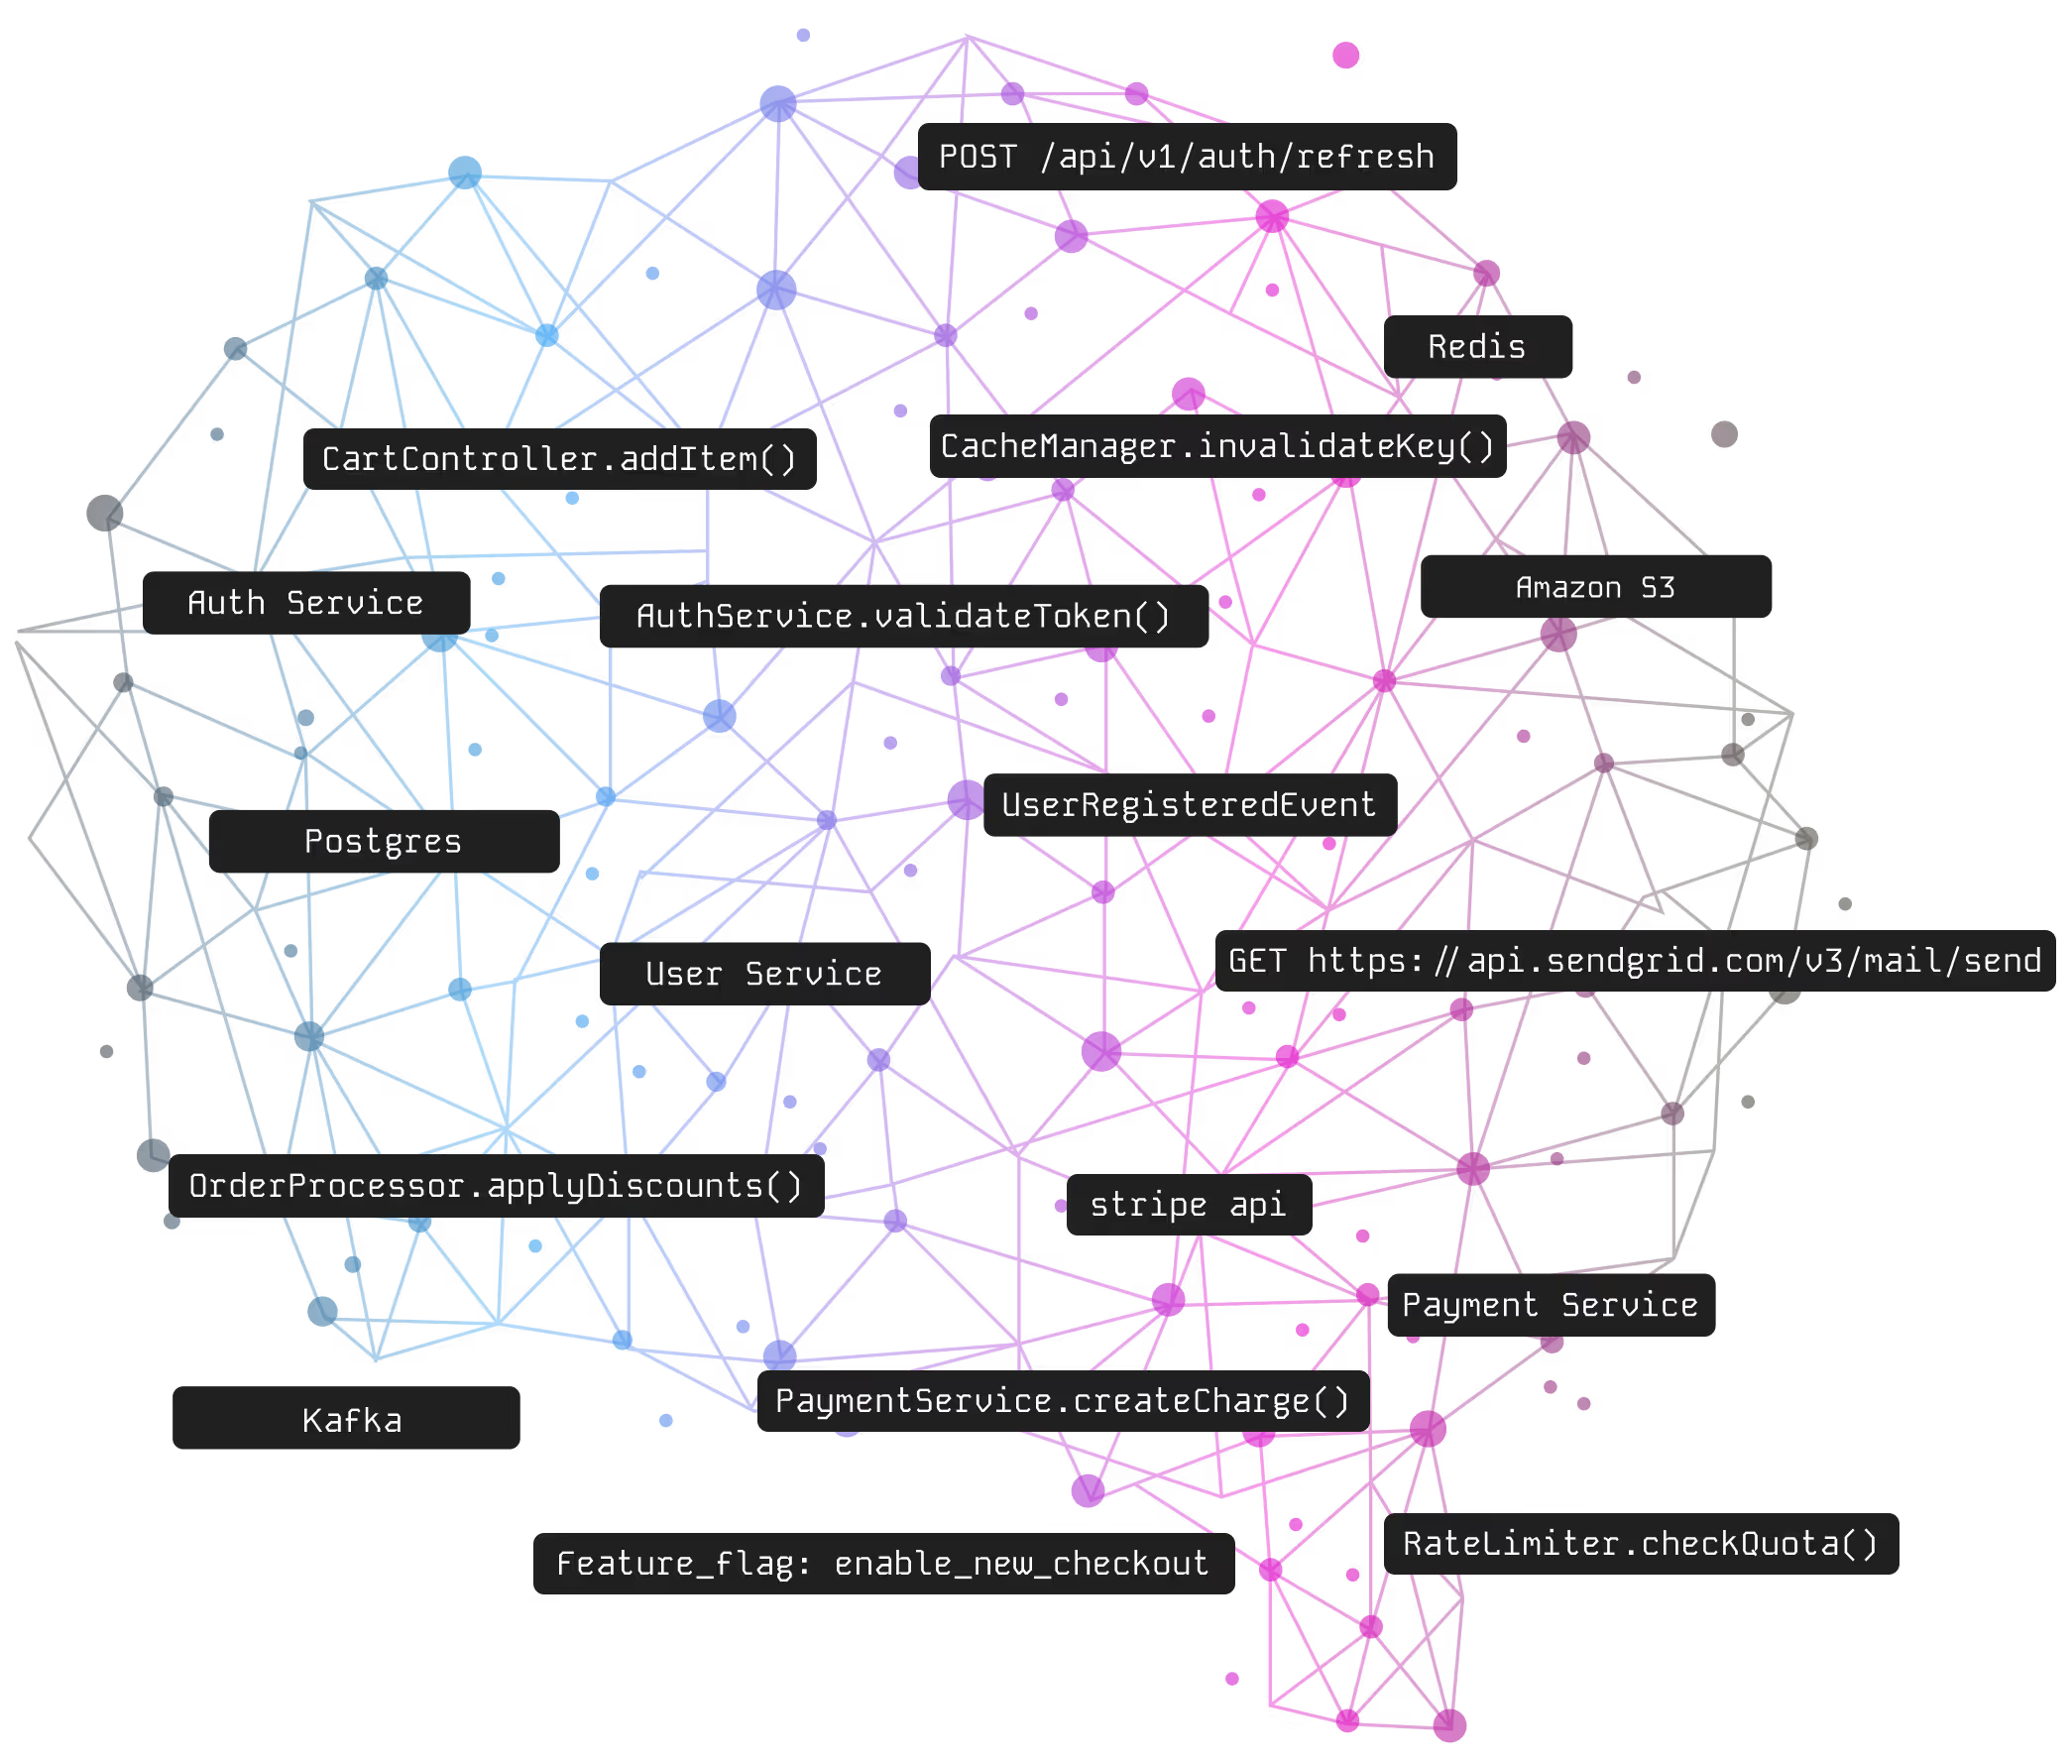
Kerno connects application, infrastructure, and change data within each service’s context, giving your team a clear, shared view.

Kerno's Unified Service View

Reduce noise with granular targeted alerts

Use a visual interface to set request-level alerts for critical issues and route them to the right team.

Kerno local service map

Work only with the data that matters

Kerno analyzes all data but retains only what’s needed, eliminating complex queries or the need to sift through thousands of logs. 

Integrate with GitHub

Link code insights and ownership to services and issues so when something breaks, you have the right people with the best context fixing it.

Integrate with Slack

Send alerts to the right people and keep conversations synced between Slack and Kerno, ensuring your team stays in the loop on issues.
Streamline issue resolution

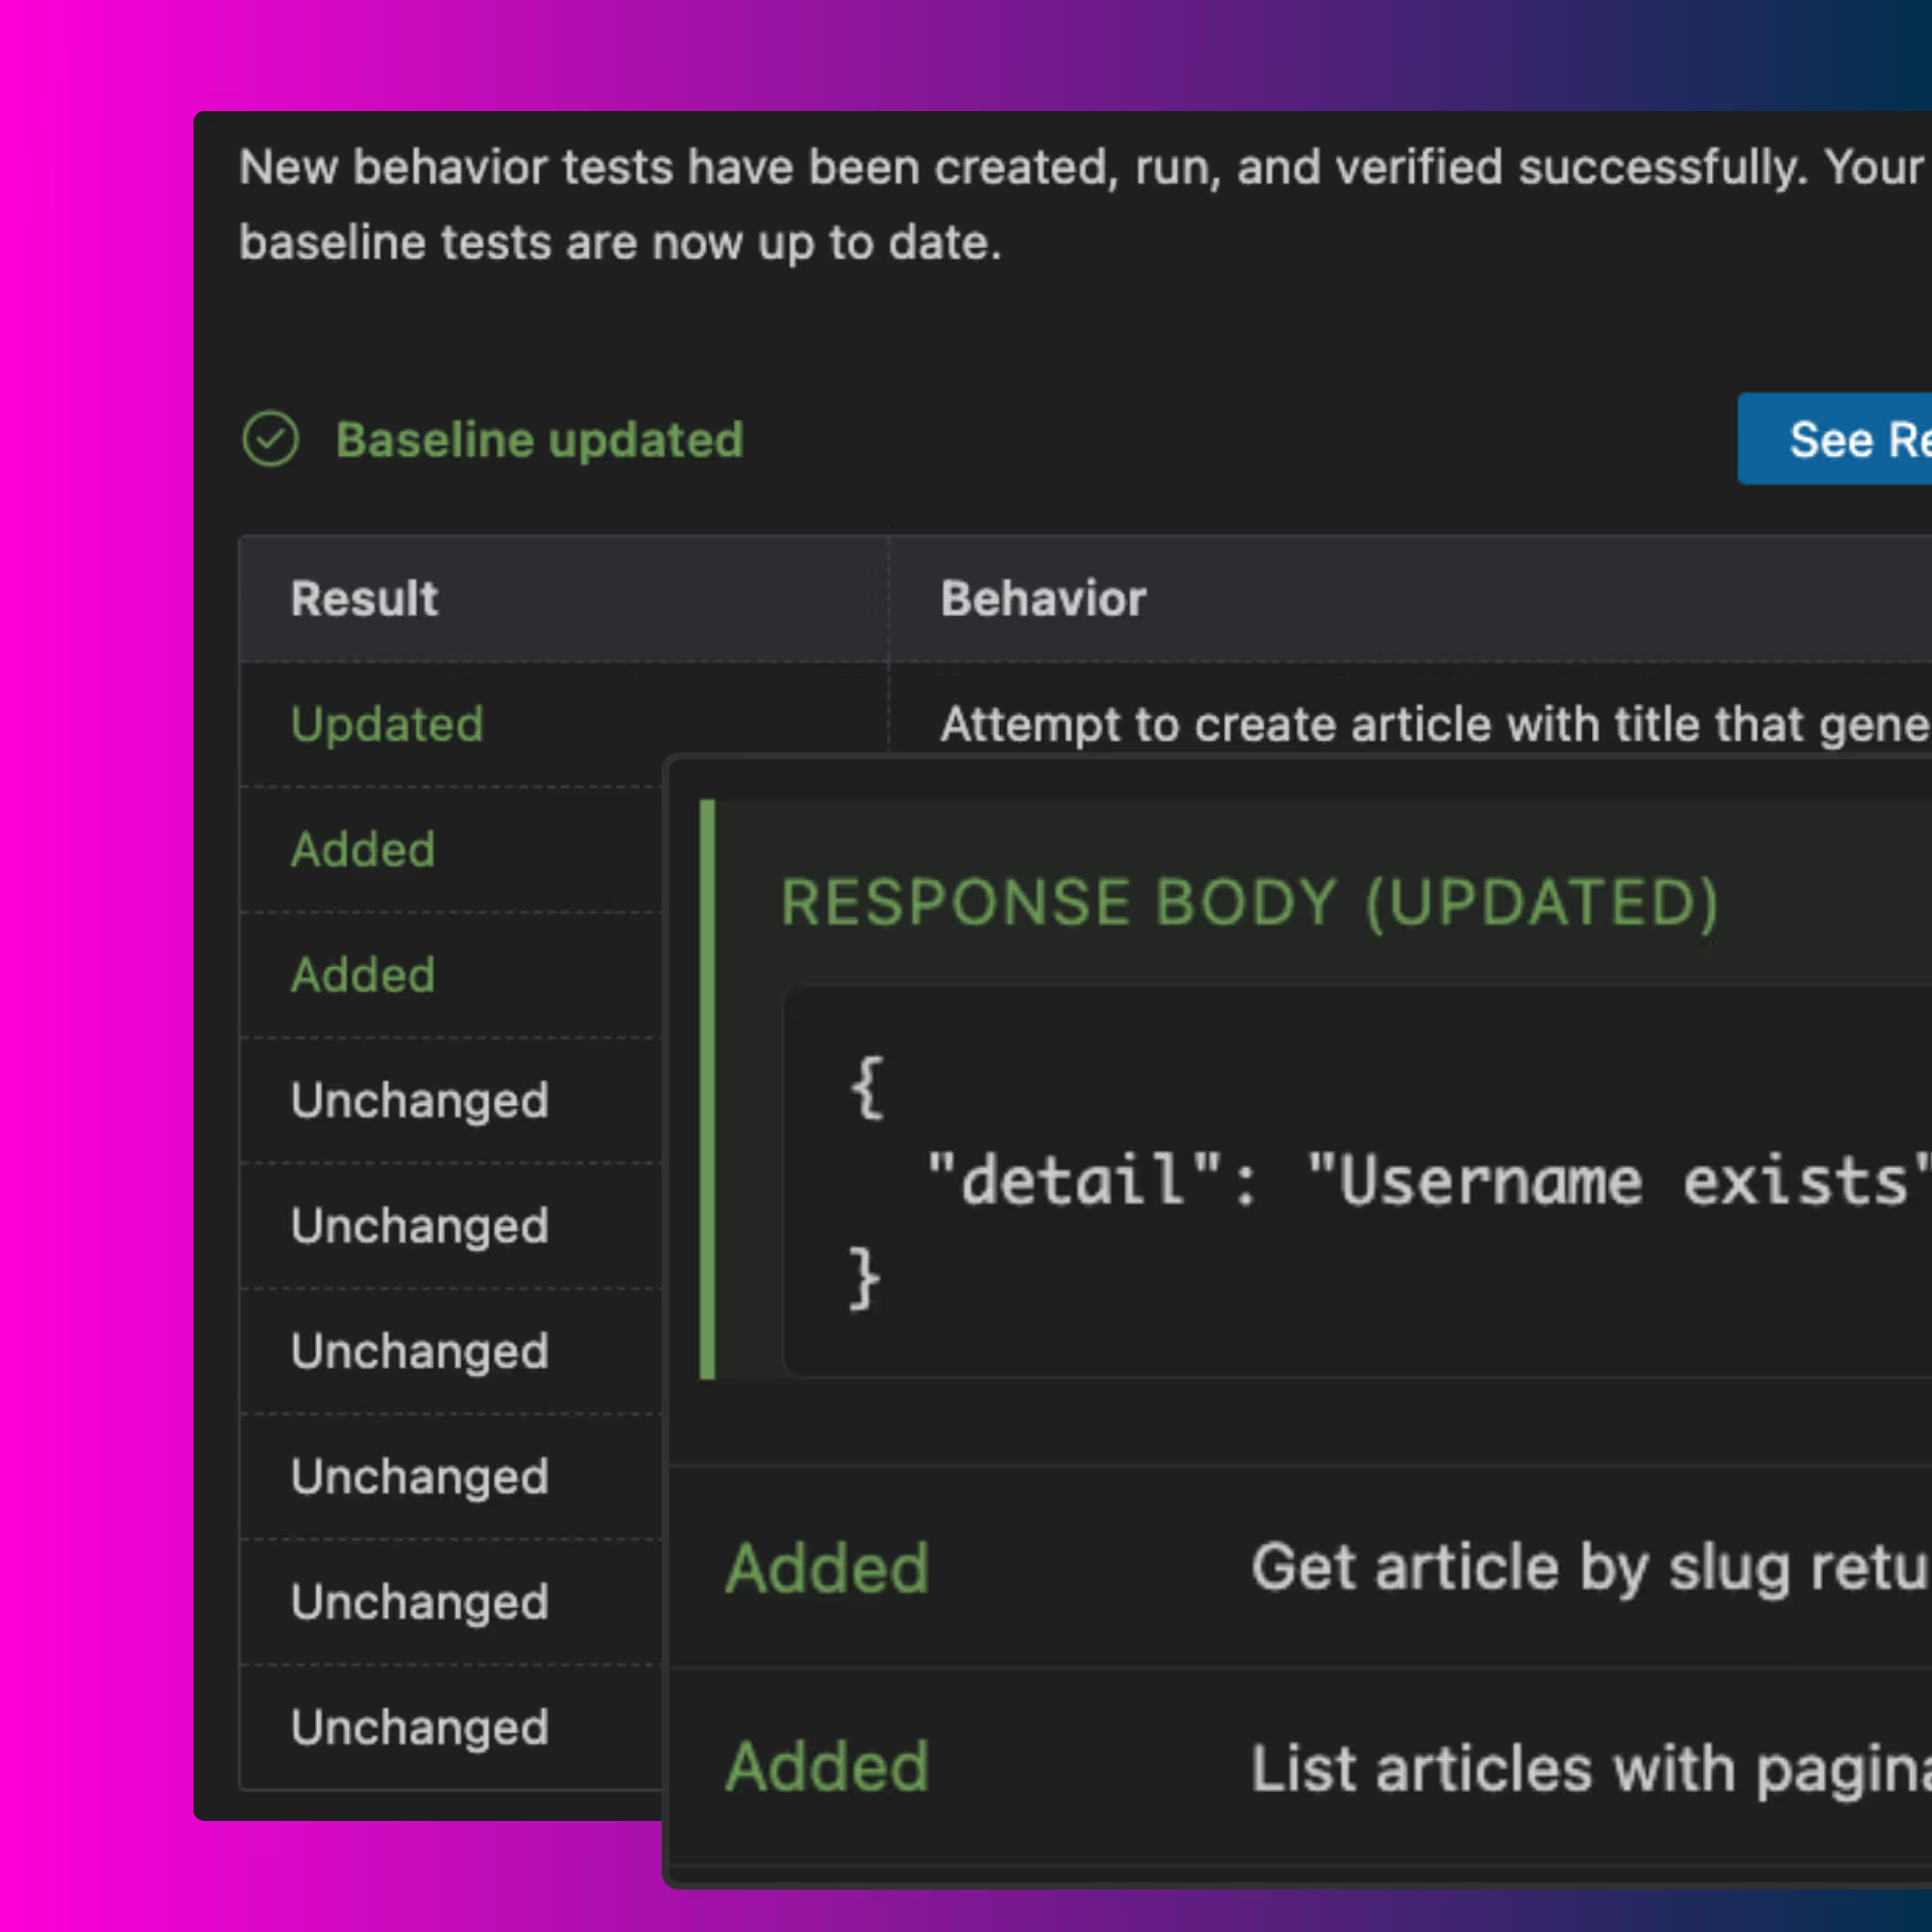
Resolve issues faster with granular and contextualized insights

See application logs, metrics, and traces fully correlated with Kubernetes metrics, events, and deployment changes. Access full trace payloads, including request body, headers, and code-level insights to pinpoint what broke, where, why, and who can fix it, all in a single focused view.

Always Keep PII data safe inside your cloud

Kerno stores all logs and traces inside your cloud to ensure your PII data is secure. Data in flight is then encrypted from your storage to UI.

Reduce data volume by 90% with smart sampling

Kerno leverages smart sampling algorithms to store only a fraction of traces and logs to minimize cost while providing a full picture.

Reduce infra cost with an object storage optimized architecture

Kerno leverages cost-efficient object storage  to minimize total ownership costs while ensuring performance and reliability.

Effortless K8s observability, built for developers, at 30% of the cost.