
Network Observability
Observability is used to describe the ability to understand the current or past state of a software system. In a separate article, we’ve covered the three main pillars of observability (metrics, logs, and traces). A similar approach can be applied when it comes to networks and physical infrastructure. Although many of these concepts are obstructed by software engineers via cloud-first architectures, the concepts are still applicable when it comes to instances, traffic between nodes, and network traces. Furthermore, advancements in protocols such as eBPF allow engineers to access kernel-level messaging data which is critical to capturing and understanding network traffic that’s exchanged between different nodes.
Simply put, Network Observability is the ability to capture, process, and understand the data related to a network's state with the purpose of troubleshooting production issues and
Key Goals of Network Observability
There’s a difference between visibility and network observability.
Network Observability - Insightful Intelligence
The first fundamental goal of network observability is to create insights that matter to the user. In other words, the information collected about the network must be contextualized.
What does that mean?
Imagine that you’re collecting data about the traffic on a specific port. At some point, the port experiences a significant spike in traffic. Does this matter? The answer depends on the application, the reason, and the state of the port after the spike. Will anyone act on the information about this spike? The information is not “insightful” and should be discarded if the answer is no.
Now, imagine that the same port experiences a gradual increase in traffic—in the first week, the traffic averages 150% of what’s expected; the second week, it raises to 200%, and in the third—300%. Surely, someone should be looking at what’s going on.
The simple example above illustrates the need to contextualize the data collected. It’s not enough to store and present raw data to the user, as drawing meaningful conclusions with that information may be challenging.
Network Observability - Automation of Root Cause Analysis w/ High Degree of Probability
Figuring out the true cause of an issue is extremely difficult. It is, therefore, critical to collect the necessary data and relay the degree to which the conclusion of the analysis is accurate. In other words, the challenge in modern network observability systems isn’t to capture information and raise alerts as thresholds are exceeded; the challenge is in being able to pinpoint relationships between different networks / systems and be able to indicate how likely the problem is to be in one region or another.
Inference is yet another term that often gets thrown around when it comes to network observability conversations and concepts. Being able to infer a meaningful piece of information requires the right infrastructure, data, and processing. By leveraging historical data, relationships between systems, and knowledge of “similar” systems, it’s possible to generate data that isn’t available simply by collecting real-time information. This information can help engineers solve problems that are difficult to uncover without inference.
Network Observability - Understanding the Impact on the End-User
Network Observability allows us to gain understanding of the overall system. It’s important to keep in mind that from a user standpoint, not all system failures / inefficiencies are made equal. In other words, it’s important for a robust network observability system to identify the impact some of these outages may have on user experience.
For example, consider an e-commerce platform that delivers highly seasonal items. The company expects an inflow of users toward the holidays while the users anticipate there being “delays” in the system beyond what is normal. The company will put in place means to scale their infrastructure, but understands that some increase inlatency on the front-end is inevitable. As users go through the purchase process, their expectation is shifted toward a successful checkout experience. Should they encounter issues beyond slight delays in checking out, the business experiences a direct loss in revenue. In short, not all issues are equal when it comes to user experience; network observability needs to label services and outages from the perspective of the end-user for the application.
The example above raises yet another issue - although software infrastructures for different applications are likely to be similar, if not identical, it’s important to map out the specifics of the service mesh.
Understanding the Various Network Observability Protocols
Various protocols in the network observability space have seen advancements in the recent years. In this section, we’re going to focus on the two protocols that we believe are making the biggest impact on the industry - OpenTelemetry and eBPF.
OpenTelemetry
OpenTelemetry, or OTEL / OTel, is an open-source framework and protocol aimed at the extraction of metrics, traces, and logs from software environments. OpenTelemetry has gained a lot of traction in the Network Observability community as it is lightweight, easy to deploy, and provides a simple way of “piping” data into various tools. In fact, most players in the network observability space provide a module or component that is compatible with the ingestion of OpenTelemetry data.
Code Instrumentation
The first step of leveraging OpenTelemetry in network observability is to instrument the underlying code and infrastructure. Instrumenting is the action of adding code that will pass certain data when executed. The most basic form of instrumentation in software engineering is adding console string output that allows us to see what’s happening. OpenTelemetry specifies the standard that dictates what and how code must be instrumented to maintain consistency across applications, systems, and organizations.

OpenTelemetry Components
OpenTelementry is a protocol that defines certain components needed to collect, process, and present the data. In this section, we’ll briefly cover the function of these components within OpenTelemetry.
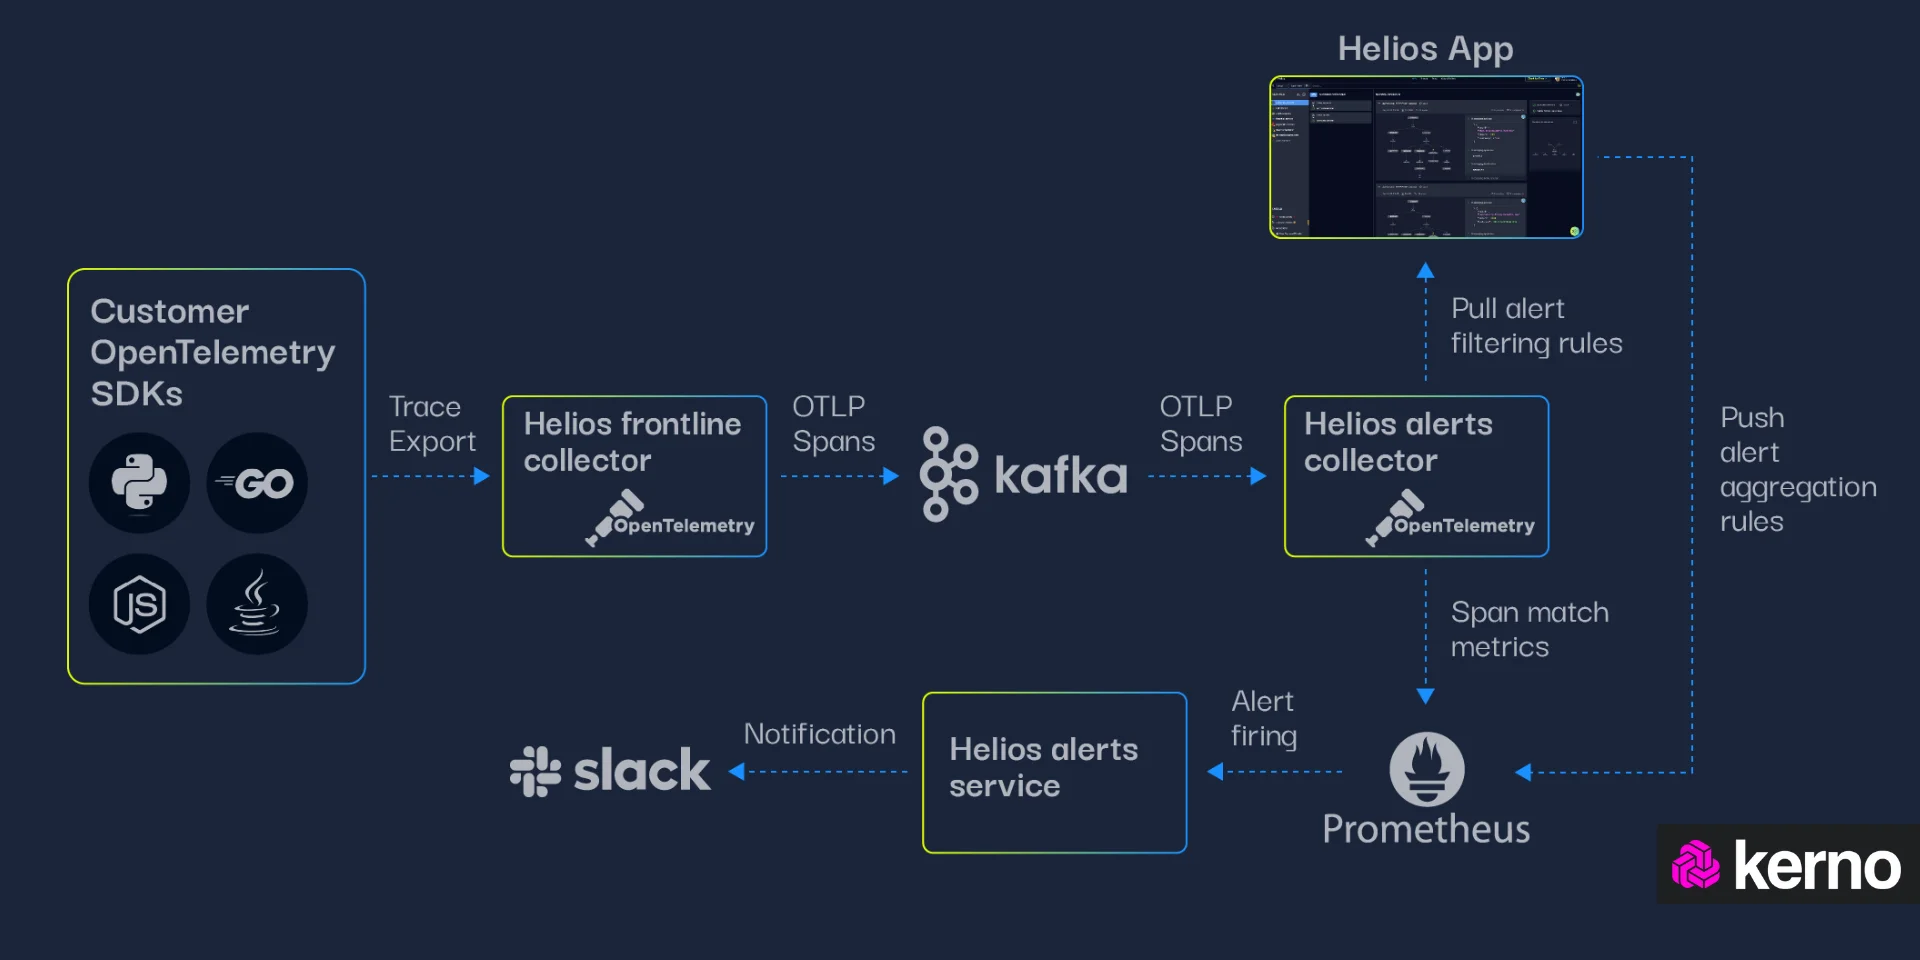
- Software Development Kits [SDKs] | A collection of libraries and tools that developers can use to instrument their applications for distributed tracing, metrics collection, and logging. The SDK provides the necessary components to integrate OpenTelemetry into an application, allowing it to generate and transmit telemetry data to various backends for monitoring and analysis.
- OpenTelemetry Collector | A component designed to collect, process, and export telemetry data from distributed systems. The main purpose of the OpenTelemetry Collector is to simplify the burden of instrumenting every individual service or application in a distributed system, providing a centralized solution for telemetry data collection and processing.
- OpenTelemetry Receiver | A receiver is a component responsible for ingesting telemetry data from various sources into the OpenTelemetry Collector. Receivers act as entry points for different types of telemetry data, including traces, metrics, and logs, allowing the Collector to collect data from diverse sources within a distributed system.
- OpenTelemetry Processor | Processors are components responsible for manipulating and transforming telemetry data as it passes through the Collector. Processors sit between receivers (which ingest raw telemetry data) and exporters (which send processed telemetry data to monitoring systems), allowing for various operations to be performed on the data before it is exported.
- OpenTelemetry Exporter | Exporters are used to forward processed data from the collector into external applications / back-end systems. OpenTelemetry may have one or many exporters, and it’s common to see multiple endpoints for the data collected via OpenTelemetry.
Challenges of OpenTelemetry
OpenTelemetry has been adopted by many organizations across the globe. Many have saved on increasing bills from the top observability platforms (Ex: Datadog, New Relic, Dynatrace, etc.) by switching to their own implementation of OpenTelemetry. However, OpenTelemetry does have certain challenges.
- Instrumentation & Languages | OpenTelemetry supports various programming languages, including C++, C#, Erlang, Go, Java, JavaScript, PHP, Python, Ruby, Swift, and limited support on Rust. It’s important to note that instrumentation is a tedious exercise regardless of the language used. Many companies we’ve talked to struggle to maintain consistency and a cost-effective approach to instrumenting their software and infrastructure.
- Data Limitations | Different forms of data and objects have varying degrees of support in OpenTelemetry. You should review the documentation to better understand the state in which your language, SDK, and specific data collection point it. For example, while support for tracing is fairly extensive, support for logs in different environments is still being developed.
- Implementation & Ongoing Maintenance | The reality of most enterprise infrastructures and code is that they change on a frequent basis. As discussed above, OpenTelemetry requires accurate data collection from instrumented code. This typically requires software engineers / developers to have a culture that understands the value, the importance, and the know-how of observability in addition of the work they must put in to make sure everything’s up to date.
- Reliance on 3rd Party Tools / Unforeseen Costs | Typically, customers are looking to reduce their current costs by switching from a network observability tool to their own implementation based on OpenTelemetry. However, it’s important to note that they will likely use certain 3rd party tools to aggregate and process some of the data. The customer will thus continue to incur certain costs associated with whichever platform they choose. Lastly, keep in mind that a “swap” from one platform to another will depend on how your code is instrumented; most vendors will advertise a plug-and-play solution; from our experience, that’s rarely as smooth as the vendors make it seem.
eBPF
eBPF stands for "extended Berkeley Packet Filter." It's a powerful and versatile technology that allows users to run custom programs within the Linux kernel without the need to modify or recompile the kernel itself. Originally developed as an extension to the traditional Berkeley Packet Filter (BPF) for network packet filtering, eBPF has evolved into a general-purpose framework for running sandboxed programs within the kernel.
eBPF has gained popularity in recent years as engineers discovered that it’s possible to get granular data without high overhead on a reasonably reliable basis.
Advantages & Challenges of eBPF in Network Observability
It goes without saying that eBPF provides the right information / data that is relevant to network observability - you can capture packets at this level and, by processing the payload, understand who the sender, destination, and contents are. This information is relevant in understanding the system, passing logs, performance monitoring, and inference.
- Safety and Security | One of the biggest concerns of end-users when it comes to eBPF is the safety and security of their services. It’s important to realize that the Linux kernel is a stable environment in which eBPF code will be executed and killed should it not conform to the standards for Linux.
- Dynamic No-Downtime Data Acquisition | eBPF is a protocol that doesn’t require the system to go down. As long as the kernel / Linux version is compatible with the version of the protocol you’re looking to deploy, there should be no downtime in deploying a solution that is based on eBPF.
- Low Overhead | Most network observability solutions are quite resource-intensive. It’s common in our conversations to hear about benchmarks between 10-20% of increased computation cost for some 3rd party observability solutions. eBPF integrations benchmark at around 1-2% of overhead.
- No Instrumentation | The “no instrumentation” in eBPF is a plus and a minus. On one hand side, engineers don’t need to deploy agents / instrument their code which saves them a lot of time and effort. On the other hand, it’s important to recognize that there’s simply no way of picking up some of the business information without instrumenting code. This is especially true in monolithic solutions where a lot of processing happens within the instances, making it difficult to understand what’s happening at the kernel level.
Frequently Asked Questions on Network Observability
Below are a few questions we’ve heard in our conversations about network observability. If you’re interested in continuing a conversation with out team or to learn more about our proposed approach, don’t hesitate to reach out.
What is the difference between network monitoring and observability?
Monitoring typically refers to the ability to gather information about the state of infrastructure while observability is the practice that encapsulates the three - monitoring, logs, and traces. In other words, monitoring is a subset of observability, which only refers to collecting information about infrastructure components.
Why is network observability important?
The main objective of observability is to provide the most accurate and cost-effective picture that describes your system. This is important because this information is used to troubleshoot issues and find opportunities for improvement which result in tangible dollars back to the business. In other words, if you can reduce MTTR (the time it takes to fix an issue) your business will continue to earn.