Introduction to K9S
Kubernetes comes with a steep learning curve for engineers all over the world. It takes time, effort, and substantial software and architectural understanding to create, manage, and troubleshoot clusters in a production or development environment. An array of tools exist to help with different tasks engineers deal with on a daily basis when it comes to Kubernetes, cloud, software, deployment, etc.
In this tutorial, we’ll take a look at K9s - We’ll understand what it is, how to install it, how it helps engineers work with cluster components, and which commands and features are available for the users.
Requirements
- Kubernetes Cluster | Can be local or remote, preferably with a few nodes and pods.
- CLI access to the control node | In these examples, we’re using Putty to connect to the control node, but most CLI tools should work.
Getting Started with K9S
You’ll need to install K9S wherever you’re able to access your kubectl CLI. Here’s a brief overview of the setup we’re using for our Kubernetes cluster:
- Dell PowerEdge R730xd server hardware
- Proxmox Hypervisor Software - Installed to virtualize various VMs on the server.
- 4x Ubuntu 22.04 Nodes - 1x Control Node and 3x K8S Nodes.
- Each node is deployed as a virtual machine and has 4GB RAM / 64GB hard disk / 2 Cores allocated to it from the server.
- PuTTy Software - used to access the control node via local IP address.
Now that we’re on the same page, the first step is to access the cluster via the control node. As mentioned above, we’ll be accessing the node via PuTTy. The same process applies if you’re hosting the cluster online (Ex - cloud provider (AWS, GCP, Azure, DigitalOcean, etc.)). Here’s the command you need to run on Linux or MacOS to install K9S:
On Windows, chocolatey would be the package manager of choice:
Here’s the version of K9S we’re currently running on our cluster:
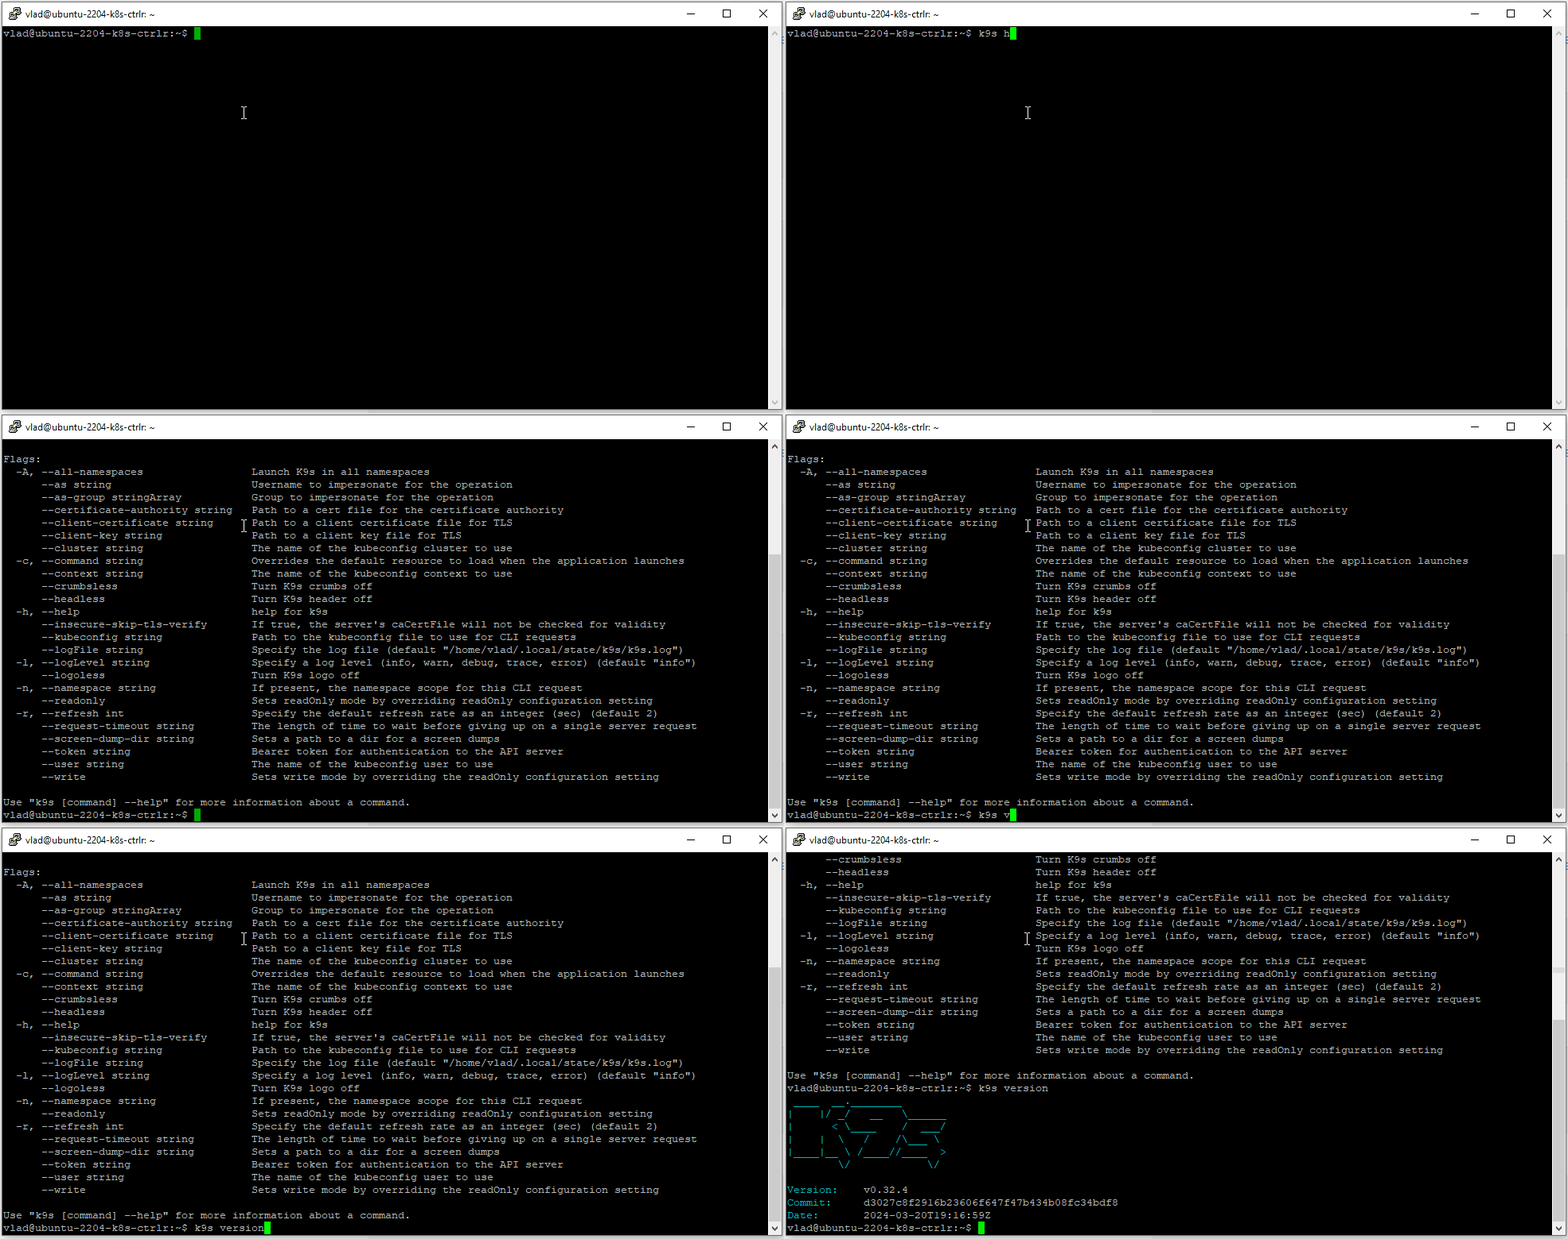
You’ll notice that we have the v0.32.4 release running on the control node.
At this point, the user can access the K9S interface that runs directly inside the CLI. What’s interesting is that you don’t need to deal with port forwarding, deploying pods / YAML files, etc. You can run the following command to access the K9S interface directly in the CLI:

In the figure above, you’ll notice that we have a visual of our cluster with the pods organized in a table, and a set of possible commands at the top of the window.
At this point, you’ve successfully installed and accessed K9S through the CLI.
Working with K9S
Now that we’ve installed and ran the K9S interface, let’s explore some commands and use cases for the end-users that manage their cluster.
Viewing Pod Details
You might be interested in understanding what’s running on a specific pod. To do so, you can use “UP” and “DOWN” arrow keys to select a pod, and “ENTER” to access the details of that specific pod:
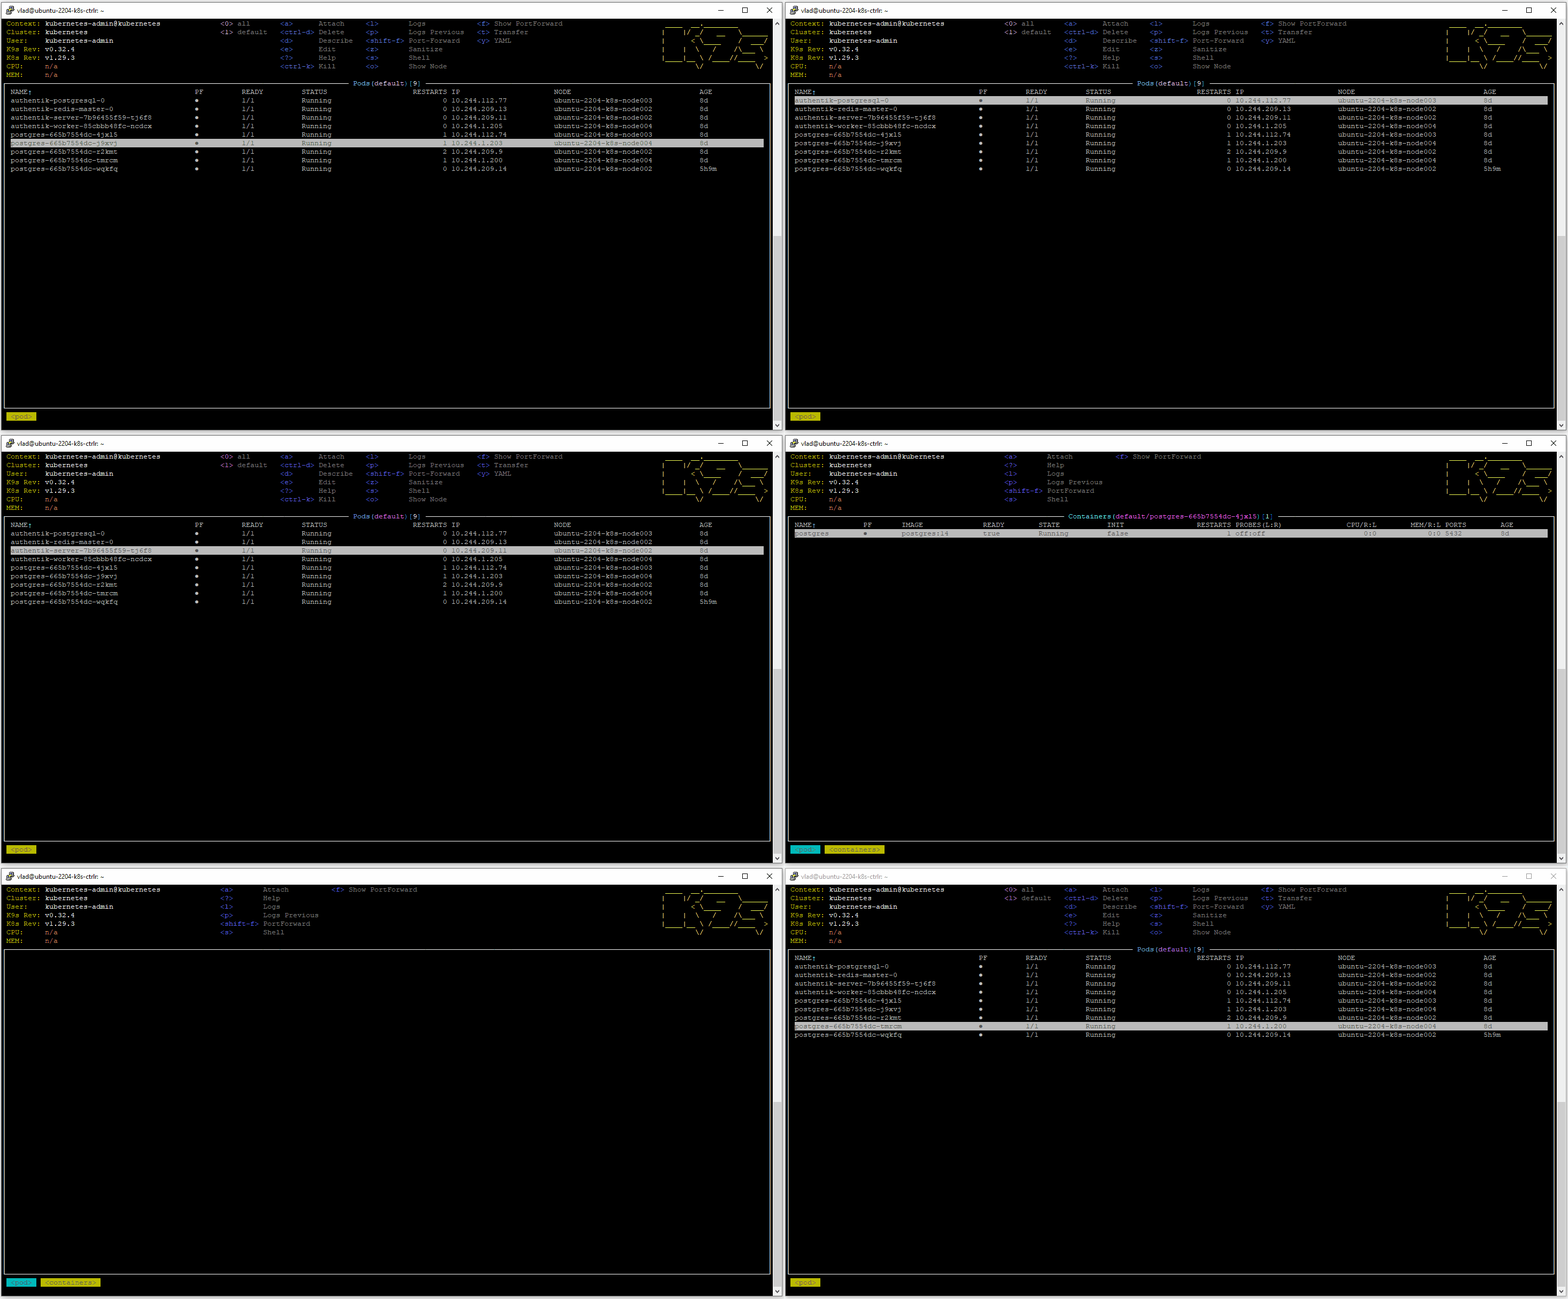
You’ll notice that as we navigate through the different components / pods of our Kubernetes cluster, we’re presented with a different table, view, and commands. You’ll also notice that you can navigate through the interface and go back to the previous screen via the “ESC” key.
In addition to viewing the details of the pod, you also have access to the YAML file of the pod, the “Describe” command as related to the pod, and the ability to delete / view logs of a pod. These commands are all accessed via shortcuts shown at the top of the screen. Here’s an example:
If you’re looking to get a description of the pod, simply navigate to the specific pod and press on the “d” key on your keyboard. In this menu, you’re presented wit the description as shown in the following image:

Notice that even at this level, the user is presented with commands that make it easier to navigate the text presented for this specific pod. Among other commands, you can search for specific keywords, navigate up / down the page, and ultimately find what you need within the file. Here are the commands you can expect to see at this level:
- <c> copy
- <e> Edit
- <n> Next Match
- <shift-n> Previous Match
- <r> Toggle Auto-Refresh
- <f> Toggle FullScreen
Viewing Pod Logs
In a separate tutorial, we’ve covered the extent to which logs can be configured in Kubernetes. In short, you can use modifiers to retrieve logs based on time, specific events, and their nature. K9S simplifies this exercise by letting the user access the logs directly from the CLI and providing the user the ability to add those modifiers on the fly via different commands.
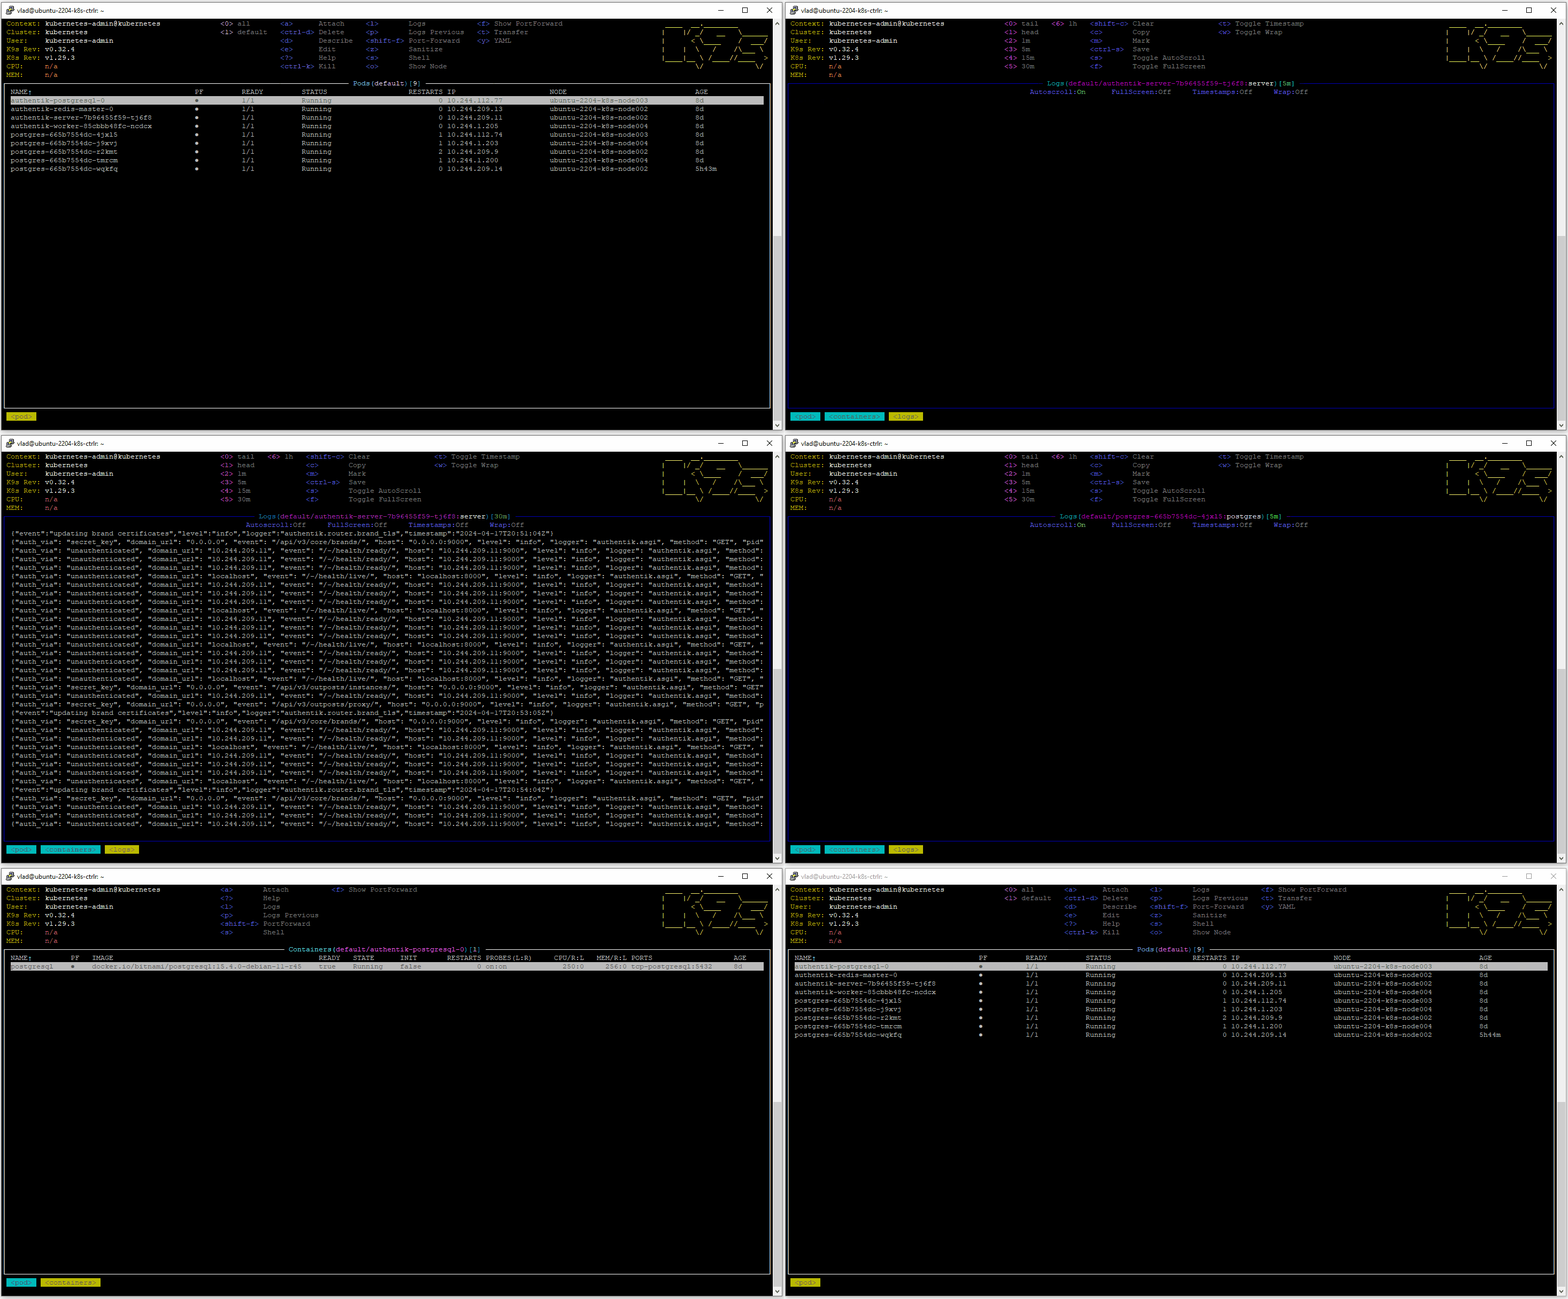
To access the logs of a pod you’ll need to select the pod by pressing “ENTER” followed by selecting the container by pressing “ENTER” once again. At this point, you’ll be presented with a few commands at the top of the screen to help you filter the logs:
- <0> tail
- <1> head
- <2> 1m
- <3> 5m
- <4> 15m
- <5> 30m
- <shift-c> Clear
- <c> Copy
- <m> Mark
- <ctrl-s> Save
- <s> Toggle AutoScroll
- <f> Toggle FullScreen
- <t> Toggle Timestamp
- <w> Toggle Wrap
If you’ve delt with logs personally, you’ll immediately know how frustrating it could be to type out CLI based commands to get what you’re looking for. In the K9S interface, you can immediately receive the logs filtered by the postfix of your choosing. Notice that you can append certain commands while others will overwrite some of the others just as they would via CLI.
Managing Kubernetes Pods
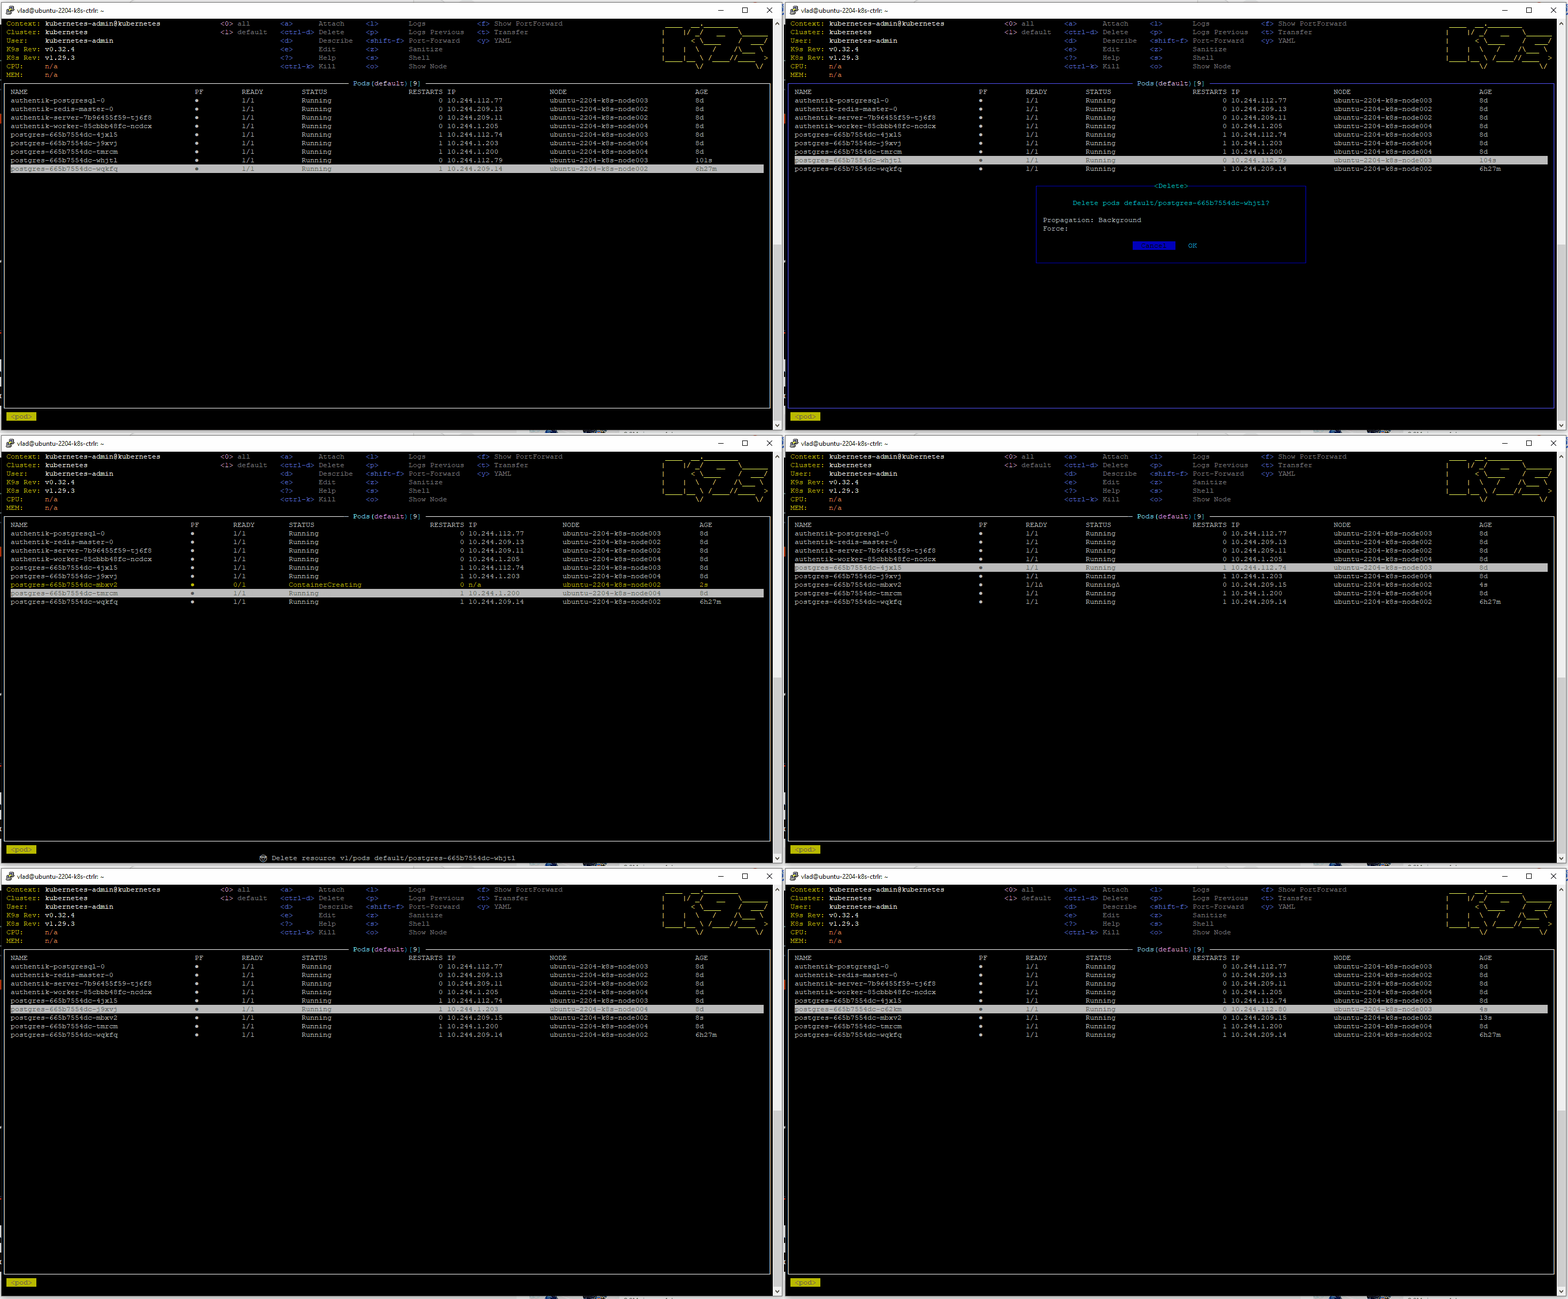
In addition to seeing various details about a specific pod, the user can manage the specifications and states of pods. For example, the user can choose to delete a pod, which will typically result in the deployment of a recreating one (as you’d expect in Kubernetes). You’ll see an example of that process in the image below:
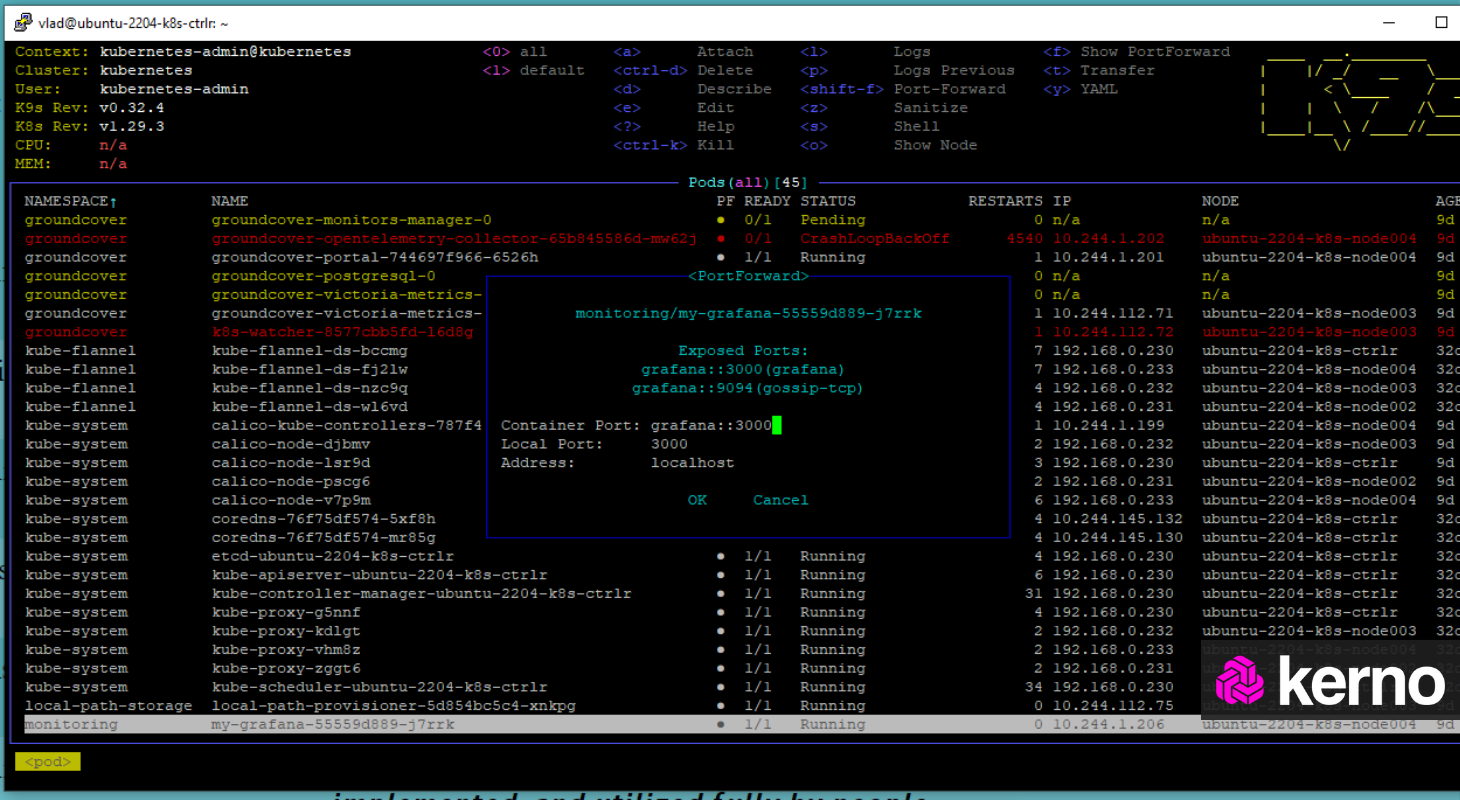
A common exercise in Kubernetes management is port forwarding. Although in production, this would typically mean deploying a proper service that would expose access to a pod, engineers can port forward a pod directly via the K8S CLI or the K9S interface. All you need to do is hit the “Shift + F” shortcut and enter the details of the pod port / local port to be exposed.
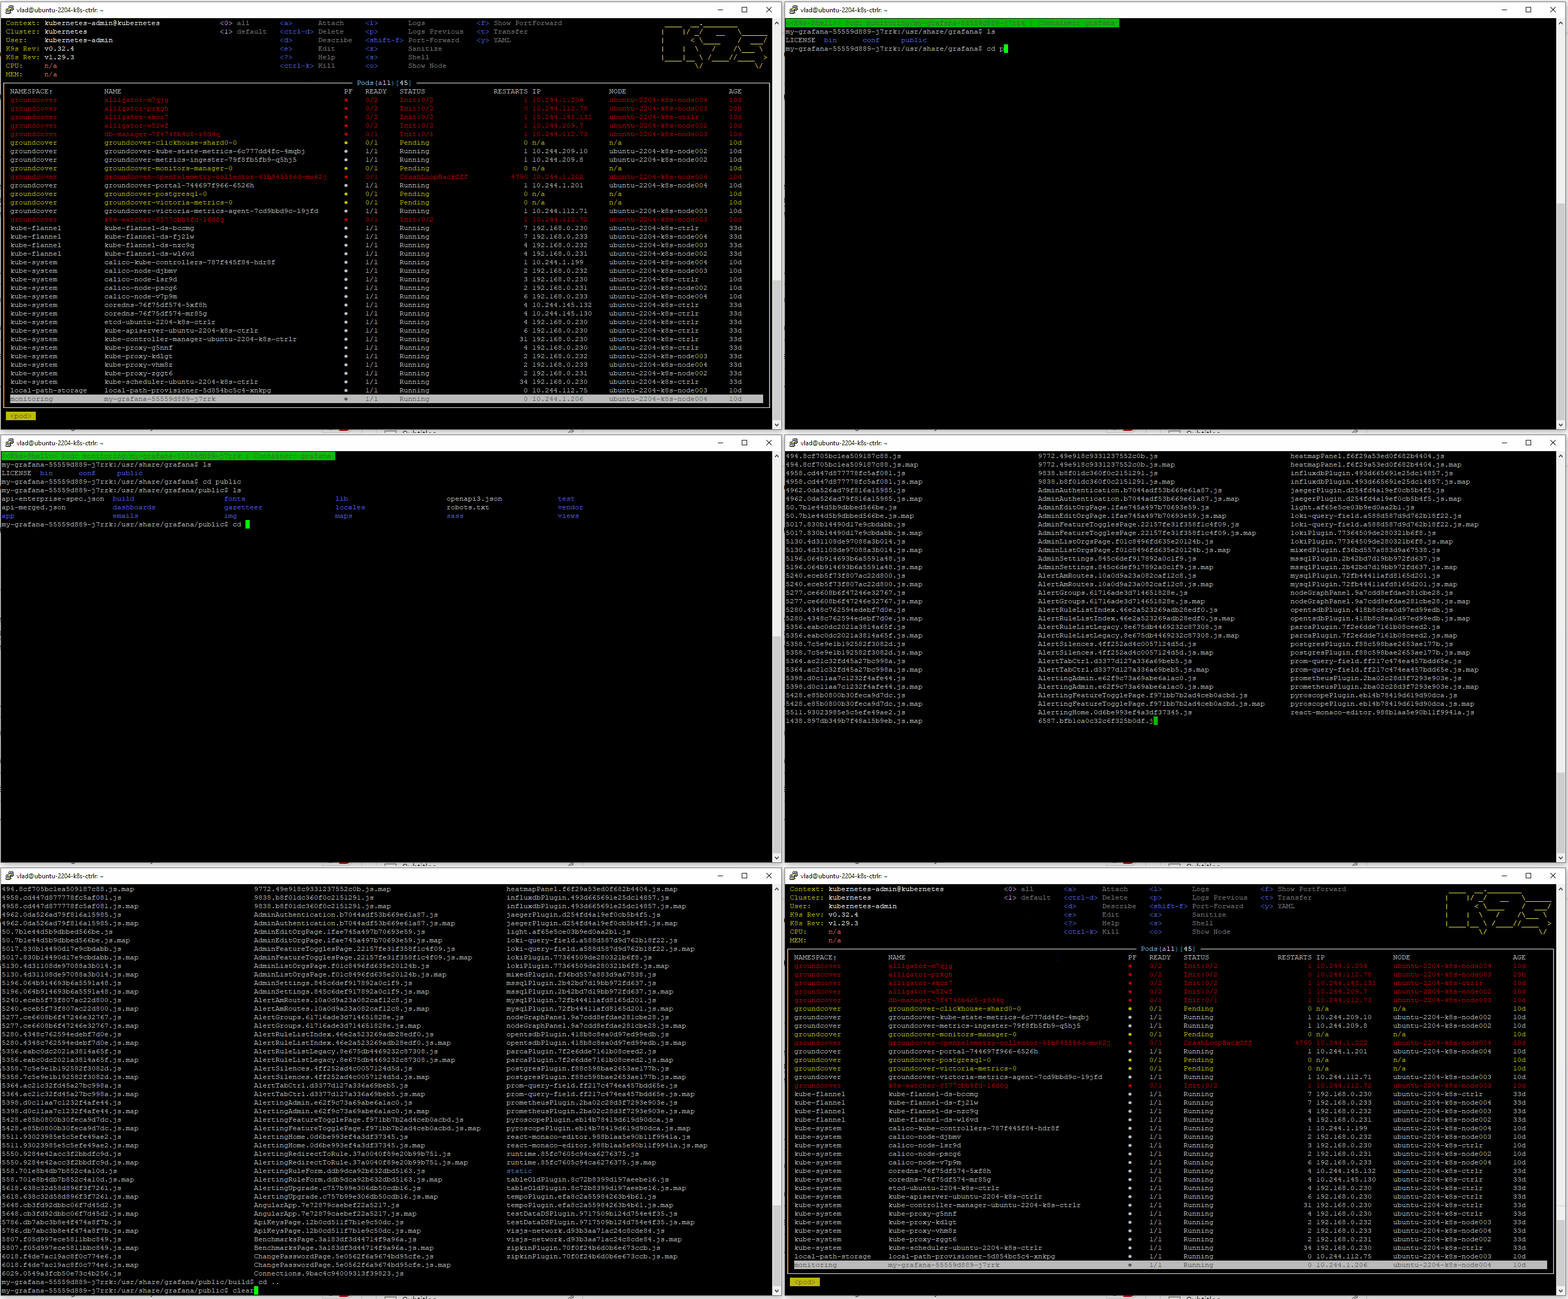
We can also access the container that is running inside of the pod by pressing the “s” key. This gives the user access to the Linux file system and the container's underlying software. The image below shows how to accomplish this and what you’ll see inside of a Grafana pod.
Conclusion on K9S
K9S is a lightweight tool for viewing and managing your Kubernetes based assets. It runs entirely within the CLI and requires no external tooling, browser access, etc which means it's super easy to install and utilize.
